![]()
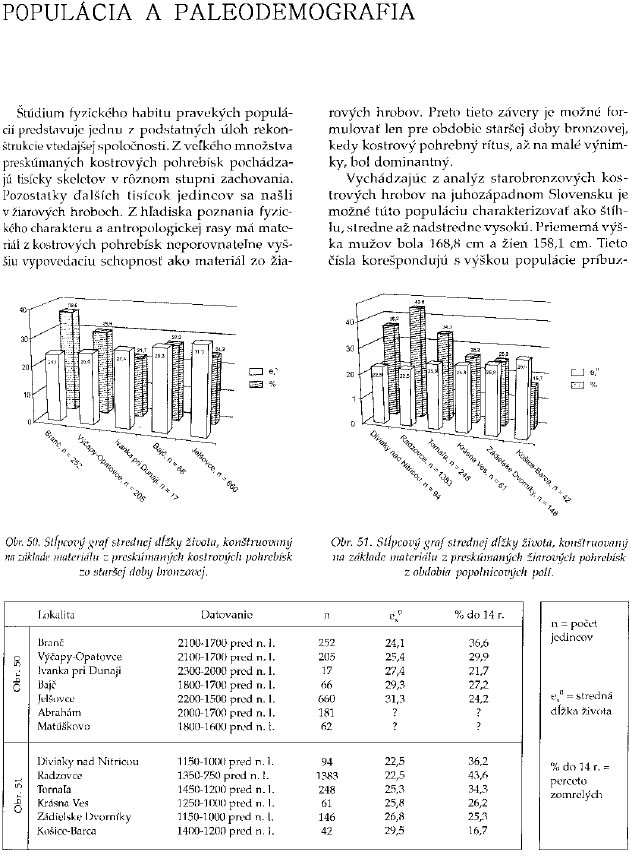
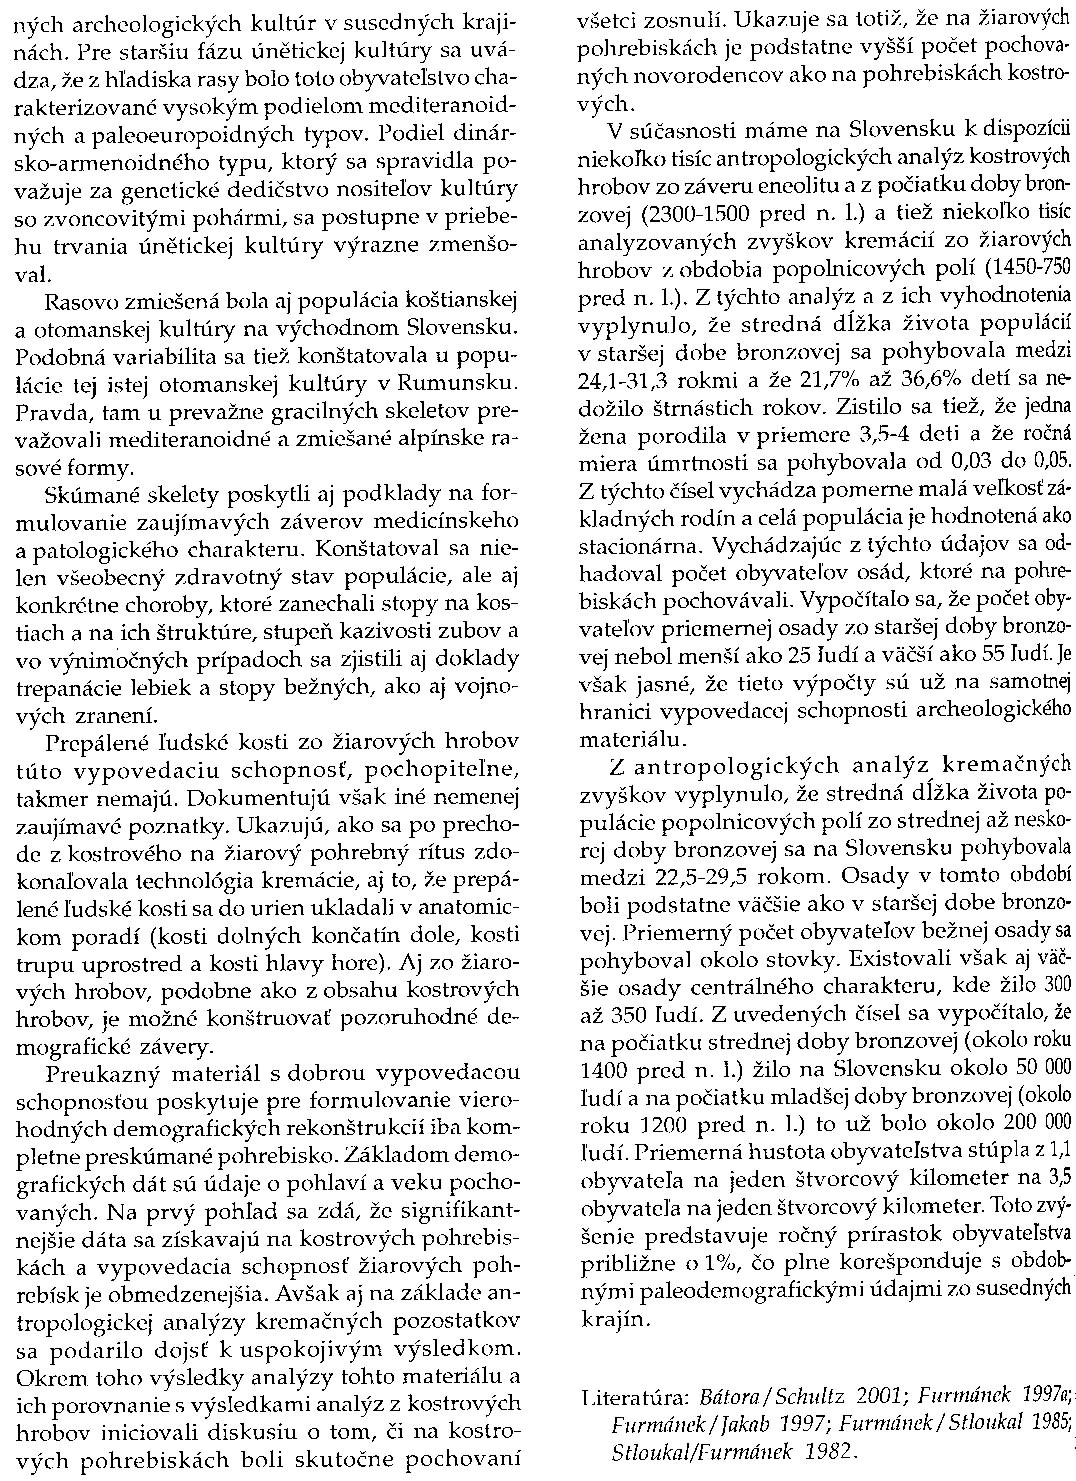
Zdroj: Václav Frmánek: Zlatý vek v Karpatoch. Keramika a kov doby bronzovej na Slovensku (2300-800 pred n.l.). SAV, Archeologický ústav, Nitra 2004
![]()
The figures which follow are based on statistics for landholding families in England. The source had figures for various periods from 1200 through 1450, but those for 1276-1300 have been used because the effects of Plague are minimized.
Life Expectancy:
Males Born 1276-1300
Age Prospects Total 0 31.3 31.3 10 32.2 42.2 20 25.2 45.2 30 21.8 51.8 40 16.6 56.6 60 8.3 68.3 80 3.8 83. For women the picture was a little different. They managed to survive their first 10 years about 10% better than men. This is a natural phenomena that is still true today. Then they began to fall seriously behind as they reached childbearing age. Women 14-40 had a life expectancy only about 50% that of males in the same group. The reason was quite simple; having babies was more dangerous than going to war. However, after 40 female life expectancy ran about 10% better than male. Again, this was the naturally greater robustness of females, plus the fact that they tended to look after themselves more carefully. At a guess, a woman who was never pregnant probably maintained that 10% edge throughout her life. This was one reason for becoming a nun, not all women were keen on having children and even many that were found them terrified of the prospect of facing the dangers of childbirth.
There seems to have been a tendency for women ---even noblewomen-- to have about one pregnancy every 18 months. Look at all the kids Edward III & Philippa had. The birth rate was apparently rather astonishing, perhaps 35%, right up there with the rest of the Third World. However, the infant mortality rate was also Third World.
Women's Death Rates
0-4 325 32.5 5-9 239 23.9 10-14 104 10.4 15-19 71 7.1 20-24 9 0.9
![]()
![]()
The book Expectations of Life by H.O. Lancaster (1990) gives one suggestive table on page 8. A restatement of the table follows. Note in the far column that what is given is the number of years a member of the aristocracy of England could expect to live, given that he had reached the age of 21.
| Time Period | Number of Males Observed | Further years of life expected at age 21 |
| 1200-1300 | 7 | 43.14 |
| 1300-1400 | 9 | 24.44* |
| 1400-1500 | 23 | 48.11 |
| 1500-1550 | 52 | 50.27 |
| 1550-1600 | 100 | 47.25 |
| 1600-1650 | 192 | 42.95 |
| 1650-1700 | 346 | 41.40 |
| 1700-1745 | 812 | 43.13 |
| *black death |
From the table it is clear that even in the middle ages, if the person could get through childhood and early adulthood, he could expect to live to 64 or so. That means that there were older people living in the society. Though the data comes from the aristocracy, it is argued that it applies more generally in the society. While the aristocracy are less affected by famines due to their wealth, they are more susceptible to death from serving in the military.
Zdroj: http://www.business.ualberta.ca/rfield/LifeExpectancy.htm
![]()
autor: Martin
Ostatná úprava 12/7/08